Suggested Protocol
Here we provide a suggested protocol for more rigorously benchmarking deep learning optimizer. It follows the same steps as the baseline results presented in the DeepOBS paper
Create new Run Script
In order to benchmark a new optimization method a new run script has to be written. A more detailed description can be found in the Simple Example and the the API section for the Standard Runner, but all is needed is the optimizer itself and a list of its hyperparameters. For example for the Momentum optimizer this will be.
1 2 3 4 5 6 7 8 9 | import tensorflow as tf
import deepobs.tensorflow as tfobs
optimizer_class = tf.train.MomentumOptimizer
hyperparams = [{"name": "momentum", "type": float},
{"name": "use_nesterov", "type": bool, "default": False }]
runner = tfobs.runners.StandardRunner(optimizer_class, hyperparams)
runner.run(train_log_interval=10)
|
Hyperparameter Search
Once the optimizer has been defined it is recommended to do a hyperparameter
search for each test problem. For optimizers with only the learning rate as
a free parameter a simple grid search can be done.
For the baselines, we tuned the learning rate for each optimizer and test
problem individually, by evaluating on a logarithmic grid from 10e−5
to 10e2 with 36 samples. If the same tuning method is used for a new
optimizer no re-running of the baselines is needed saving valuable
computational budget.
Repeated Runs with best Setting
In order to get a sense of the optimziers consistency, we suggest repeating runs with the best hyperparameter setting multiple times. This allows an assessment of the variance of the optimizer's performance.
For the baselines we determined the best learning rate looking at the final performance of each run, which can be done using
deepobs_plot_results results/ --get_best_run
and then running the best performing setting again using ten different random seeds.
Plot Results
To visualize the final results it is sufficient to run
deepobs_plot_results results/ --full
This will show the performance plots for the small and large benchmark
set
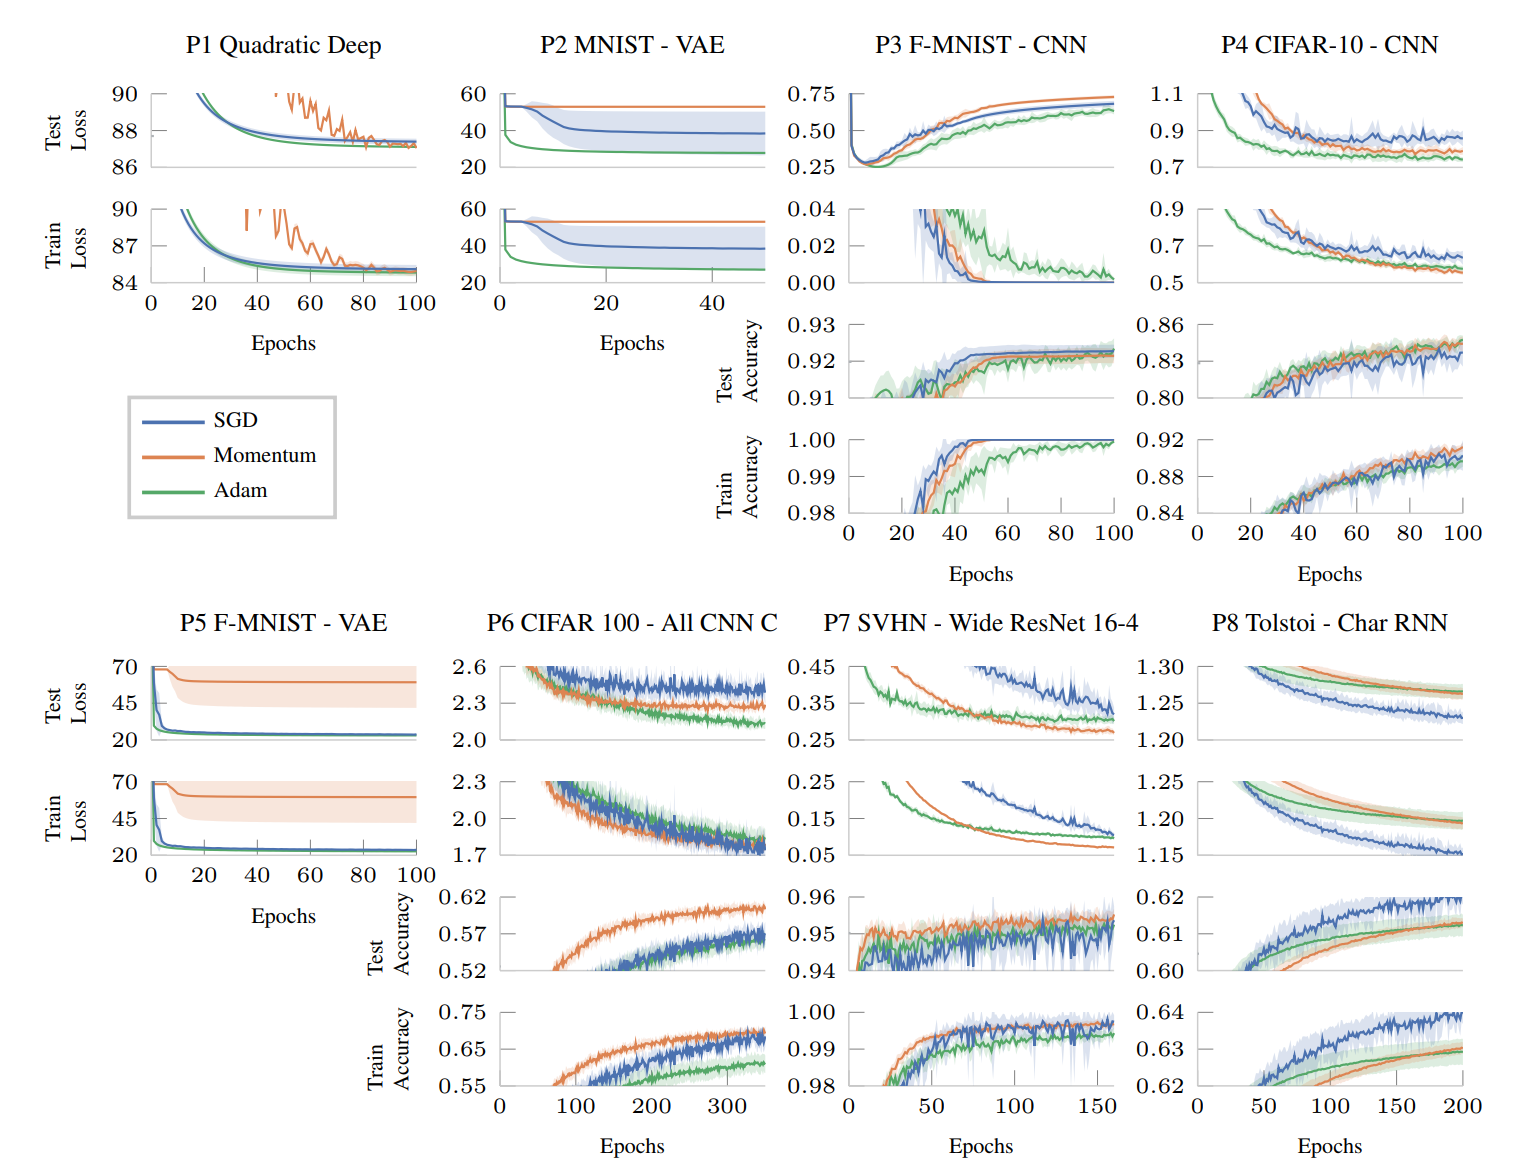
as well as the learning rate sensitivity plot
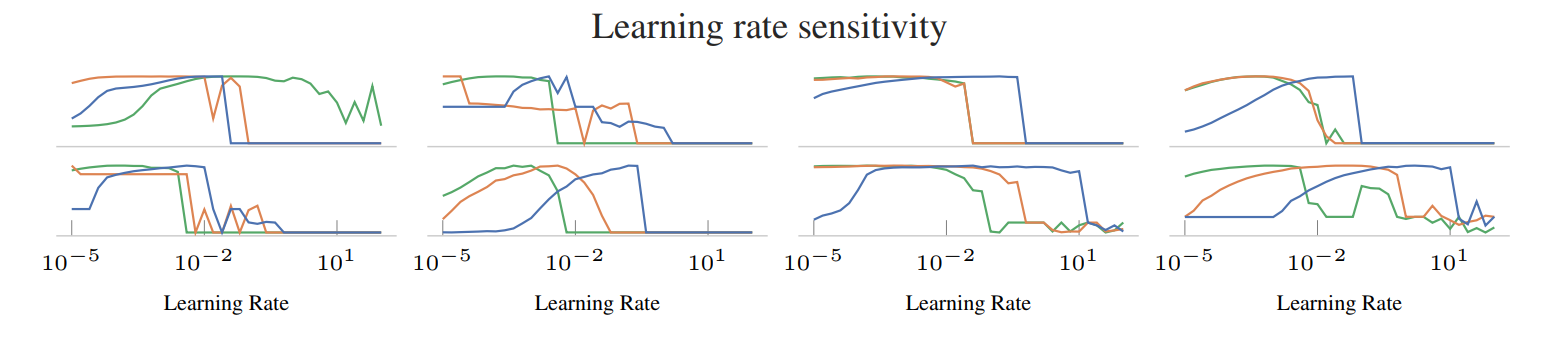
and the overall performance table
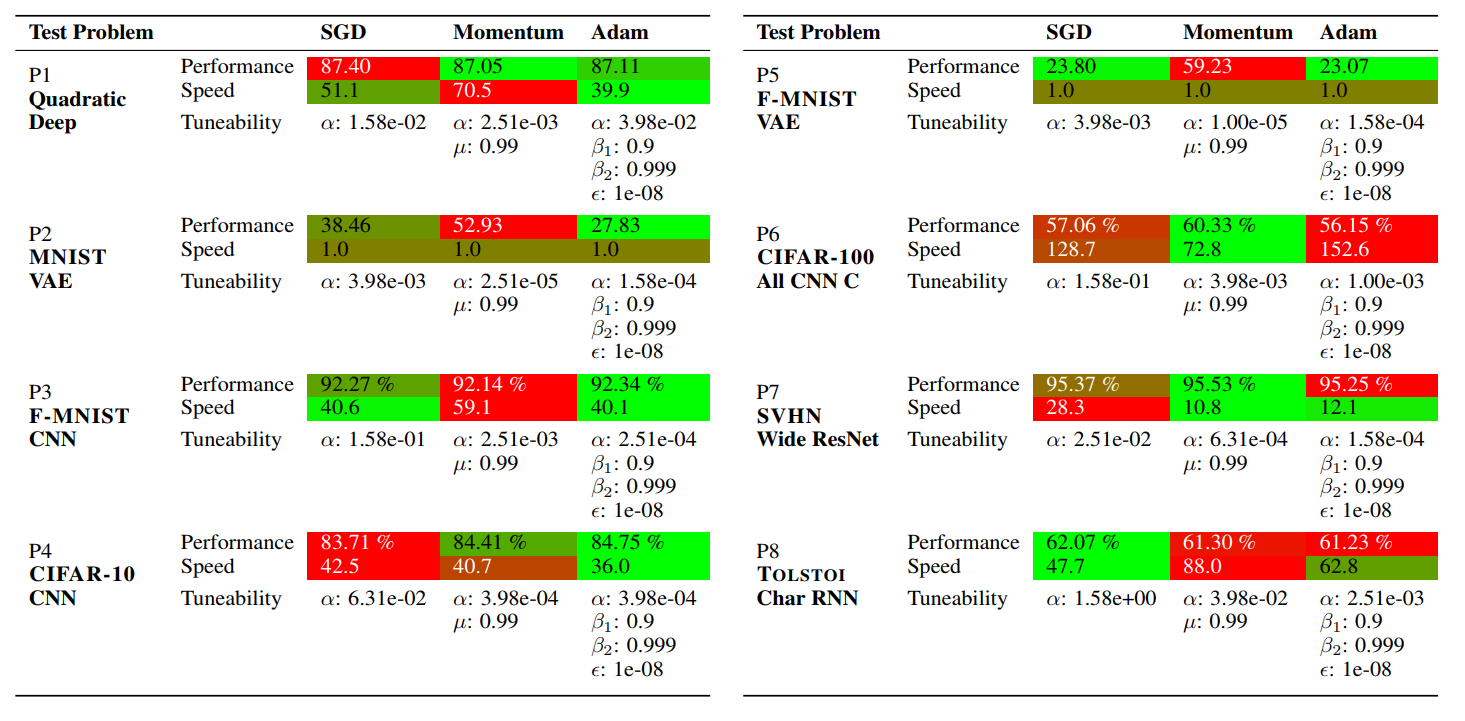
If the path to the baseline folder is given, DeepOBS will automatically compare
the results with the baselines for SGD, Momentum, and Adam.
For all plots, .tex files will be generated with pgfplots-code for direct
inclusion in academic publications.